|
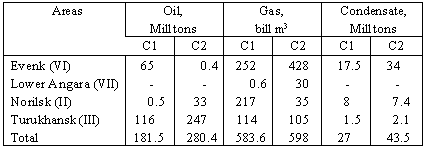
Table 1.
Hydrocarbon Resources (Bandman, et al., 1999) Located extracted reserves of hydrocarbons in the zone of proximity of the "Yenisei-NSR" transport system (by 1. 1. 1995) |

| Table 2. World Bauxite Production 1991-1996 (Ramsland, 1999) |
| 1991 | 1992 | 1993 | 1994 | 1995 | 1996 | |
|
Australia Guinea Jamaica Brazil China Venezuela India Suriname Russia Total |
40.500.000 17.070.000 11.610.000 10.360.000 5.930.000 2.000.000 4.740.000 3.140.000 95.350.000 |
39.750.000 16.000.000 11.370.000 9.370.000 6.660.000 1.120.000 4.900.000 3.250.000 4.580.000 97.000.000 |
41.320.000 17.040.000 11.180.000 9.670.000 6.470.000 2.530.000 5.280.000 3.160.000 4.260.000 100.910.000 |
41.650.000 11.120.000 11.560.000 8.670.000 6.620.000 4.770.000 4.810.000 3.800.000 3.630.000 96.630.000 |
42.660.000 12.390.000 10.860.000 8.670.000 6.700.000 5.180.000 5.160.000 3.580.000 3.500.000 98.700.000 |
43.000.000 12.500.000 11.000.000 8.760.000 7.000.000 5.200.000 5.100.000 3.700.000 3.500.000 99.760.000 |
| Table 3. Major Prime Aluminum Producers and Exporters (Ramsland, 1999) |
| Russia : Major Prime Aluminum Producers and Exporters 1994-98 000' Tonnes | |||||||
|
Name Bratsk Krasnoyarsk Alu Sayan Aluminium Siberian Urals Alu Company |
Region Irkutsk Krasnoyarsk Khakasia Sverdlovsk |
Products Primary A Primary A Primary A Primary A |
1994 751 717 285 |
1995 768 756 315 |
1996 783 777 325 322 |
1997 800 787 327 331 |
1998 |
|
Total Primary Aluminium
Production Krasnoyarsk Metall W |
Krasnoyarsk |
Roll Aluminium |
1753 22 |
1838 40 |
2207 9 |
2245 9 |
3347 |
| Table 4. Production of the Main Types of Products of the Wood-working Complex of Russia |
| Types of products | Production in Russia | Siberian part. in %% | ||||||||
| 1970 | 1980 | 1988 | 1990 | 1996 | 1970 | 1980 | 1988 | 1990 | 1996 | |
| Timber logging mill. m3 | 277 | 256 | 280 | 242 | 74 | 27.0 | 28.5 | 30.7 | 32.2 | 28.2 |
|
Sawn timber mill. m3 |
92 | 81 | 85 | 75 | 22 | 25.3 | 31.2 | 33.2 | 33.8 | 32.0 |
|
Plywood 1000 m3 |
1421 | 1460 | 1727 | 1597 | 850 | 7.3 | 11.0 | 17.0 | 16.4 | 13.0 |
|
Shaving wooden plates 1000 m3 |
... | 3491 | 5490 | 5490 | 1472 | ... | ... | ... | ... | 20.0 |
|
Fiber wooden plates mill. m2 |
171 | 386 | 501 | 483 | 184 | 5.2 | 18.1 | 19.3 | 19.5 | 25.0 |
| Pulp. 1000 tons | 4735 | 6765 | 8349 | 752 | 4200 | 18.6 | 22.6 | 25.4 | 29.3 | 32.3 |
| Paper. 1000 tons | 3476 | 4462 | 5334 | 5240 | 1800 | 3.6 | 2.7 | 2.2 | 2.1 | ... |
| Cardboard. 1000 tons | 1973 | 2536 | 3249 | 3085 | 1310 | 13.6 | 19.7 | 20.4 | 19.0 | 25.0 |
| Table 5. Population Figures for the Indigenous Peoples of the North (Sokolova & Iakovlev, 1998) |
| Indigenous Peoples | Number of indigenous peoples in 1989 and % 1979 | |||
|
Total number of indigenous peoples |
% 1979 |
Including rural |
% 1979 | |
|
1. Nenets 2. Evenks 3. Khanty 4. Evens 5. Chukchi 6. Nanaitsy 7. Koryaki 8. Manci 9. Dolgany 10. Nivhi 11. Selkups 12. Ulchi 13. Itelmens 14. Udegeitsy 15. Saami 16. Eskimos 17. Chuvantsy 18. Nganasany 19. Yukagirs 20. Kety 21. Orochi 22. Tofalary 23. Aleuty 24. Negidalts 25. Entsy 26. Oroki TOTAL |
34665 30233 22521 17199 15183 12017 9242 8459 6092 4673 3612 3233 2480 2011 1890 1718 1511 1278 1142 1113 915 713 702 622 209 190 184478 |
115,9 110,8 107,6 137,3 108,4 114,3 117,3 111,8 137,0 106,3 101,3 126,7 181,0 129,6 100,1 113,8 - 147,4 136,8 99,2 - 95,8 128,6 123,4 - - 116,5 |
28340 23909 15649 12769 12995 7210 6371 4490 5283 2284 2664 2287 1485 1186 1117 1315 639 915 698 891 468 625 408 363 117 28 134503 |
112,5 111,9 97,5 124,5 108,5 109,3 113,9 93,3 123,5 99,0 93,5 125,2 154,4 110,6 97,3 115,1 - 121,5 122,5 100,3 96,1 124,5 124,4 108,0 - - 110,9 |