"Economic
Development and the Environment"
on the Sakhalin Offshore Oil and Gas Fields II
Copyright (C) 1999 by Slavic
Research Center, Hokkaido University.
All rights reserved
Oil and Gas Development on the Sakhalin Island Shelf: An Assessment of Changes in the Okhotsk Sea Ecosystem
Alexander Leonov
| Fig. 1 |
Correlation
between the oil product concentration (LC50) for marine organisms with
their size characteristics [1]: 1 - adult species; 2 - early stages of ontogenesis; 3 - values of effective concentrations (EC50) for unicellular algae; n - numbers of data; r - correlation coefficient; (dash line indicates data do not taken into account in calculations). |
| Fig. 2 |
Correlation
between the survival time of growing roe of marine invertabrates with
the roe size at the incubation into 0.5% solution of diezel fuel and
sea water [1]: 1 - Molluska; 2 - Echenodermata; 3 - Annelida; 4 - Urochordata; 5 - Arthropoda (Balanus cariosus). |

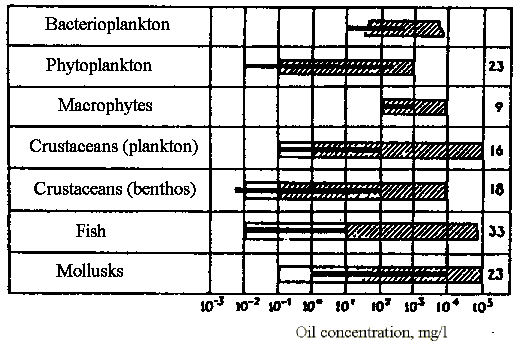
Fig.
3
Range
of toxic (rectangles) and treshold (fat lines) concentrations of
dissolved oil fractions for basic marine organism groups (unshaded part
- areas of toxic concentrations for early stages of ontogenesis;
numbers in right side - amount of studied species). Toxic concentration
indicate ranges of the content in environment at which measured indexes
have reliably decreased more than on 50% from the control in
experiments continued 2-4 days. Treshold concentrations indicate the
minimum content in environment at which measured indexes have decreased
on 50% in experiments comparable in the time with ontogenesis of
studied organism [1].

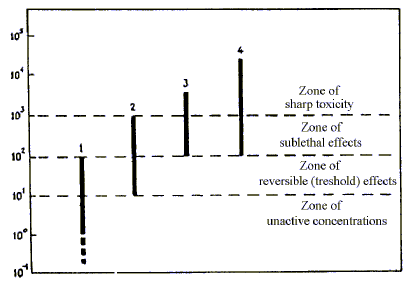
Fig.
4
Approximate
levels of biological action and ranges of specific oil hydrocarbon
content in sediments [1]:
1 - pelagic zone of seas and oceans; 2 - coastal zones; 3- bays,
estuaries, inlets, ports and other, 4 - areas of strong pollution at
oil spills, disposals and etc.